Versions and Preview
In the deployment section of your JENTIS Tag Manager you have the option to control the versions, preview, see change logs and publish the latest updates of your configuration.
Versions
Tag Management is the job of setting all the configurations on tools, tags and triggers to activate the data streams.
Each JENTIS Tag Manager configuration of your settings comes packed as a version. So you can edit and change your settings in a new version and have that separated into different packages from what is published to productive systems.
Here you can find more details on the JENTIS account and container structure, including environments of containers: JENTIS Accounts and Containers
A list of all your versions you will find in the deployment section. Each configuration version can be in on of three states:
- current edit (this one contains all the changes you did recently but yet not published)
- published to live, stage or both
- legacy (these can not be edited any more, but you can publish those to rollback a published version)
You can also inspect a log of all changes in a version.
Preview Monitor
With server side tracking architecture a preview is key. As it makes transparent what is not visible to the website visitor. The communication stream from user to any service provider (tools) is in your hand. The preview monitor enables you to preview and debug all data streams.
To open the preview monitor you must navigate to the Deployment > Versions section.
There are two different variants of the version overview screen. If only one container is currently selected than you will see an overview of your current edit version:
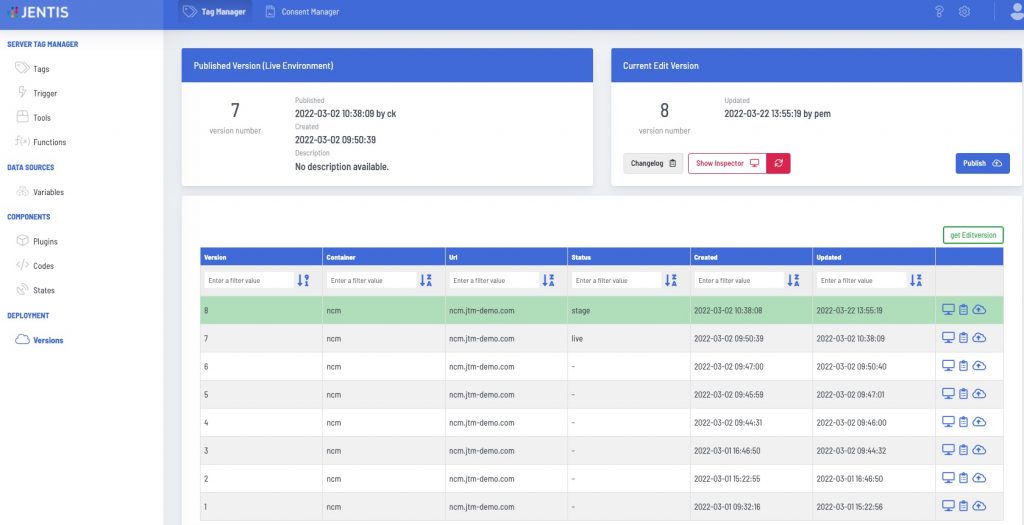
However when multiple containers are selected the version overview will display all container versions in one table overview:

The inspector is a special window that displays all streams of the server-to-server communication. That is when a tags trigger is activated and data is transmitted to the configured tool.
In the inspector window you can click on the “play”-icon to open your website in preview-mode. This query parameters will instruct the JTM to display more information for debugging.
There are two layers to inspect the information:
- frontend (in the browsers developer tools you can find information in the JS console)
- backend (here the server to server communication is displayed)
In the inspector window you will see the incoming State events and what data was then send to a tool, following a tag configuration.
The following example displays a data stream to a Google Analytics tools pageview-tag. It consists of the payload and HTTP parameters so you can check if the configuration meets your requirements.

Publishing
When your preview results look just as required then its the right time to create and publish a new version.
You can select to publish your environment to staging, production or both. When publishing to live systems that will automatically create a new “current edit”-version for the next release cycle.
In the publish-options you can also add a commit message.
